The cockpit takes shape: seven views, one factory
Three days of work turned CFactory from a board you watch into a control tower you operate — running-tasks, a live audit feed, service health, and a cockpit that now ships itself.
When we introduced CFactory the promise was one pane of glass over the PARR pipeline — plan, code, test — across PFactory, AIFactory and TFactory. Then we made it watchable and costable.
The last three days were about turning that pane of glass into something you operate, not just read. Here’s the cockpit as it stands today — seven views, one factory.
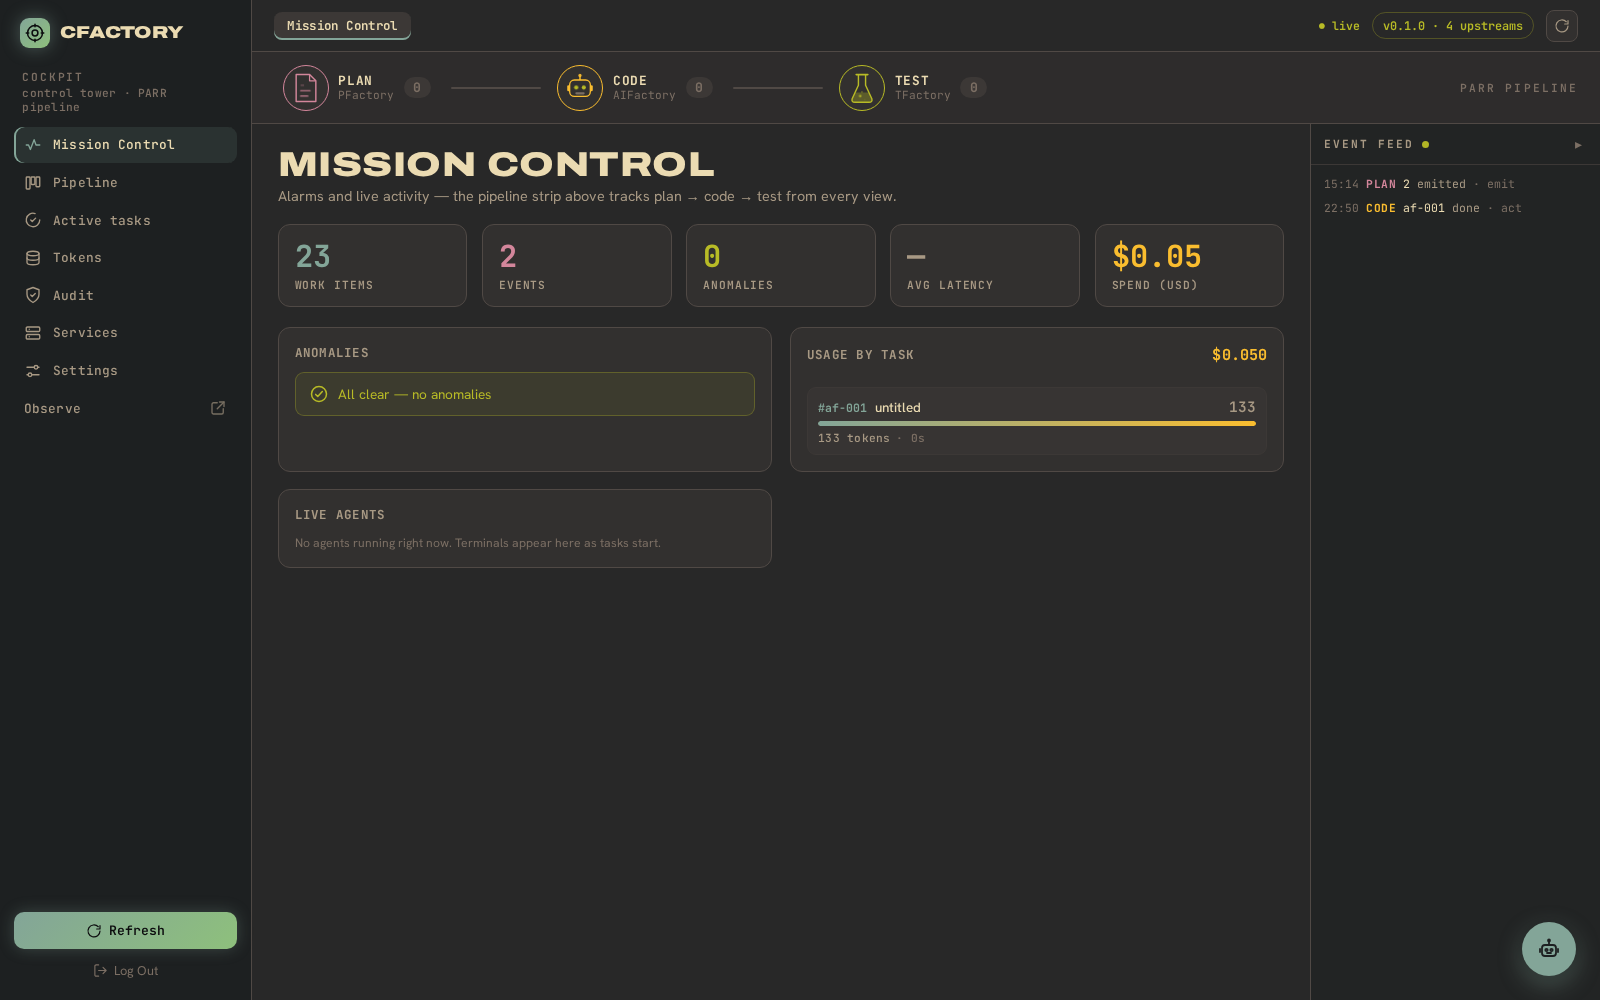
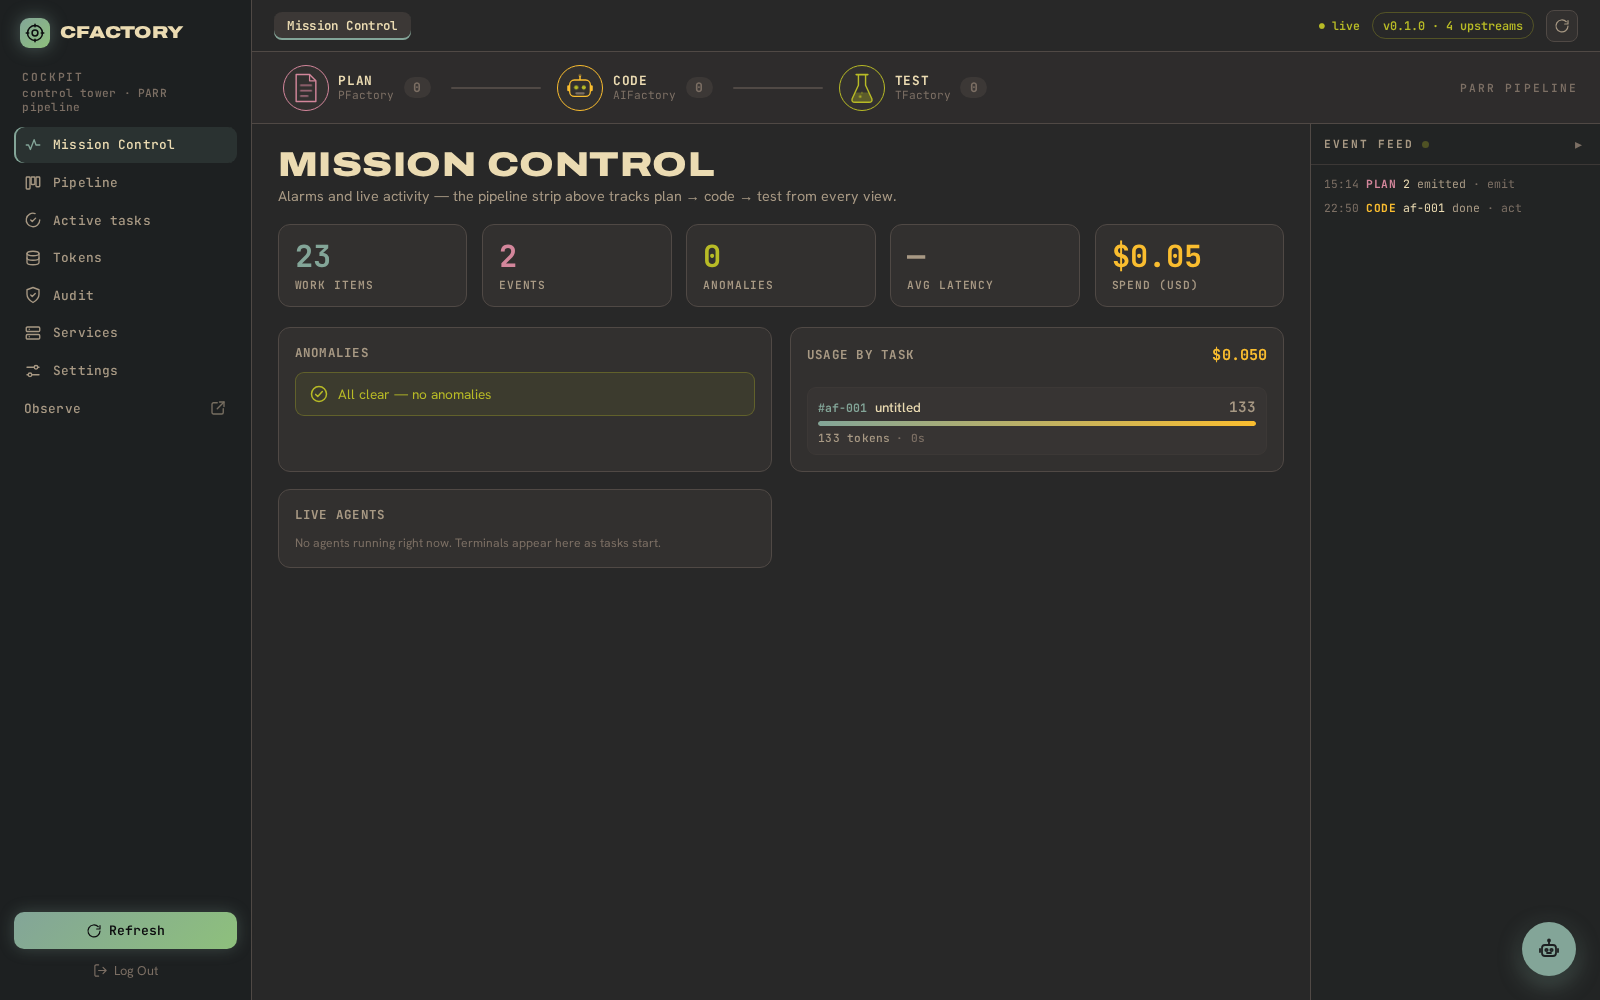
Mission Control — the whole factory at a glance
The landing view threads the PARR pipeline end to end: work items in Plan → Code → Code → Test, anomalies, and a live roster of agents. Right now it shows 13 items in flight, all in Code, with the anomaly panel reporting all clear.
Pipeline — every work item, threaded by issue
Each unit of work is a card, threaded across the three stages by its GitHub issue number — the correlation key that lets the cockpit (and the copilot) answer “where is feature X”. Click any card for live detail, including the in-progress process and its rmux terminal.
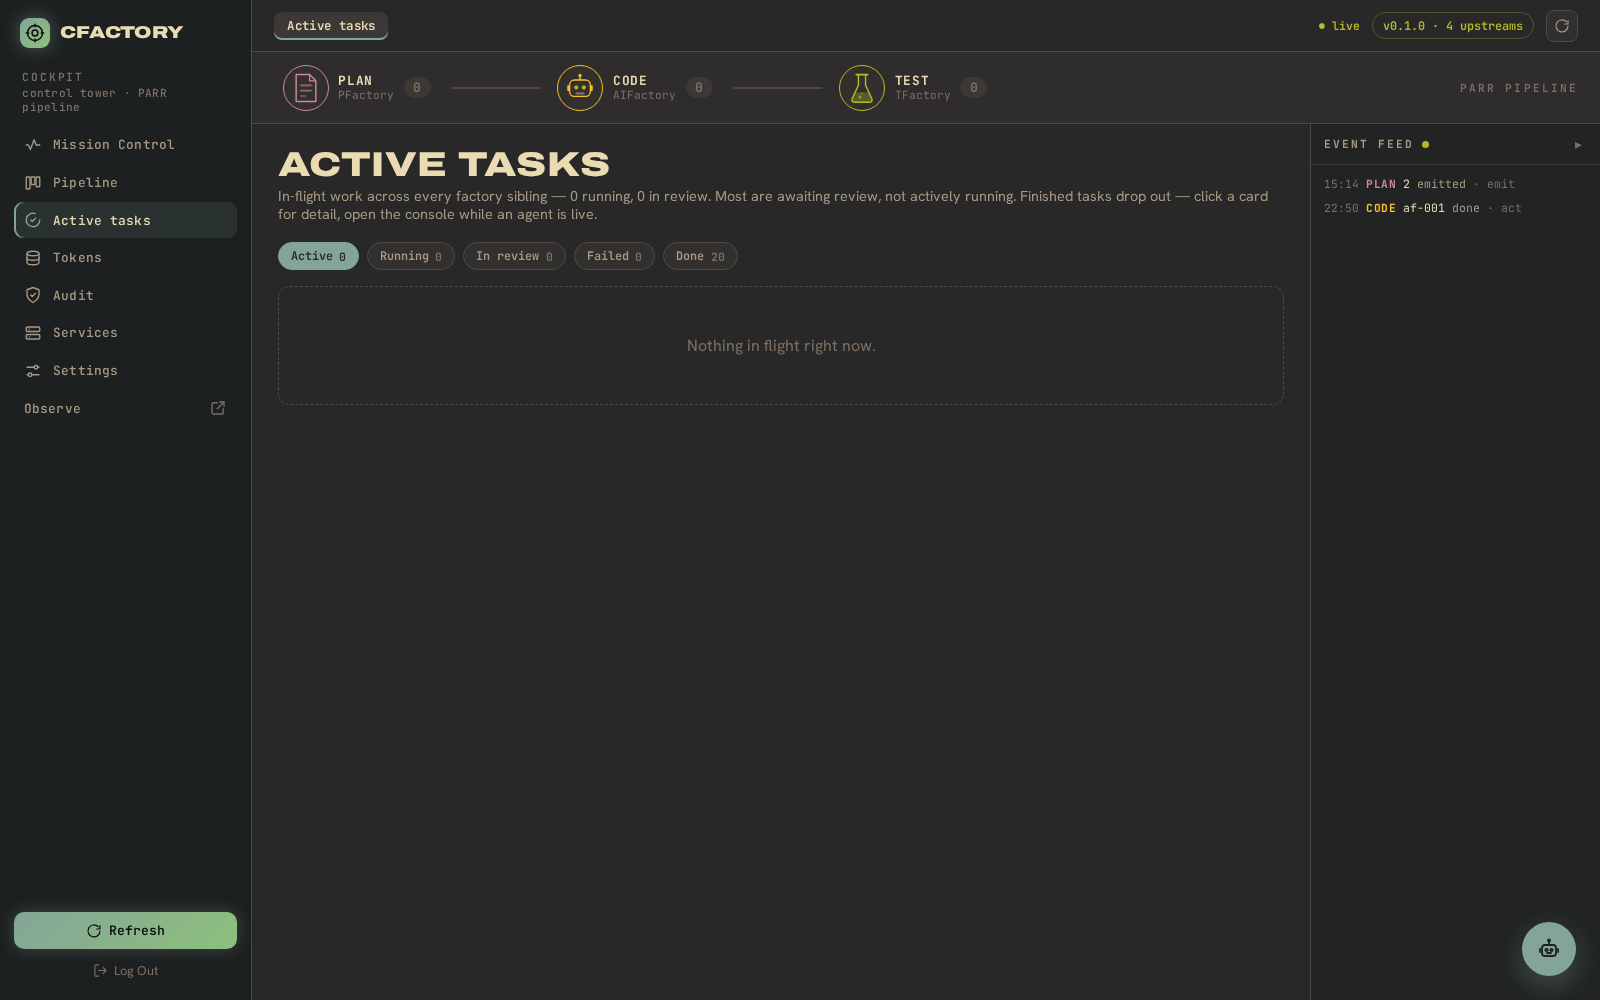
Running tasks — what’s live, how far, what failed
New this week: a dedicated Running tasks view. Filter across All / Running /
Failed / Done, and watch each sibling’s progress bar and current phase —
spec_creation, coding, validation, qa_approved, human_review — update in
place. It’s the operator’s heads-up display for everything moving at once.
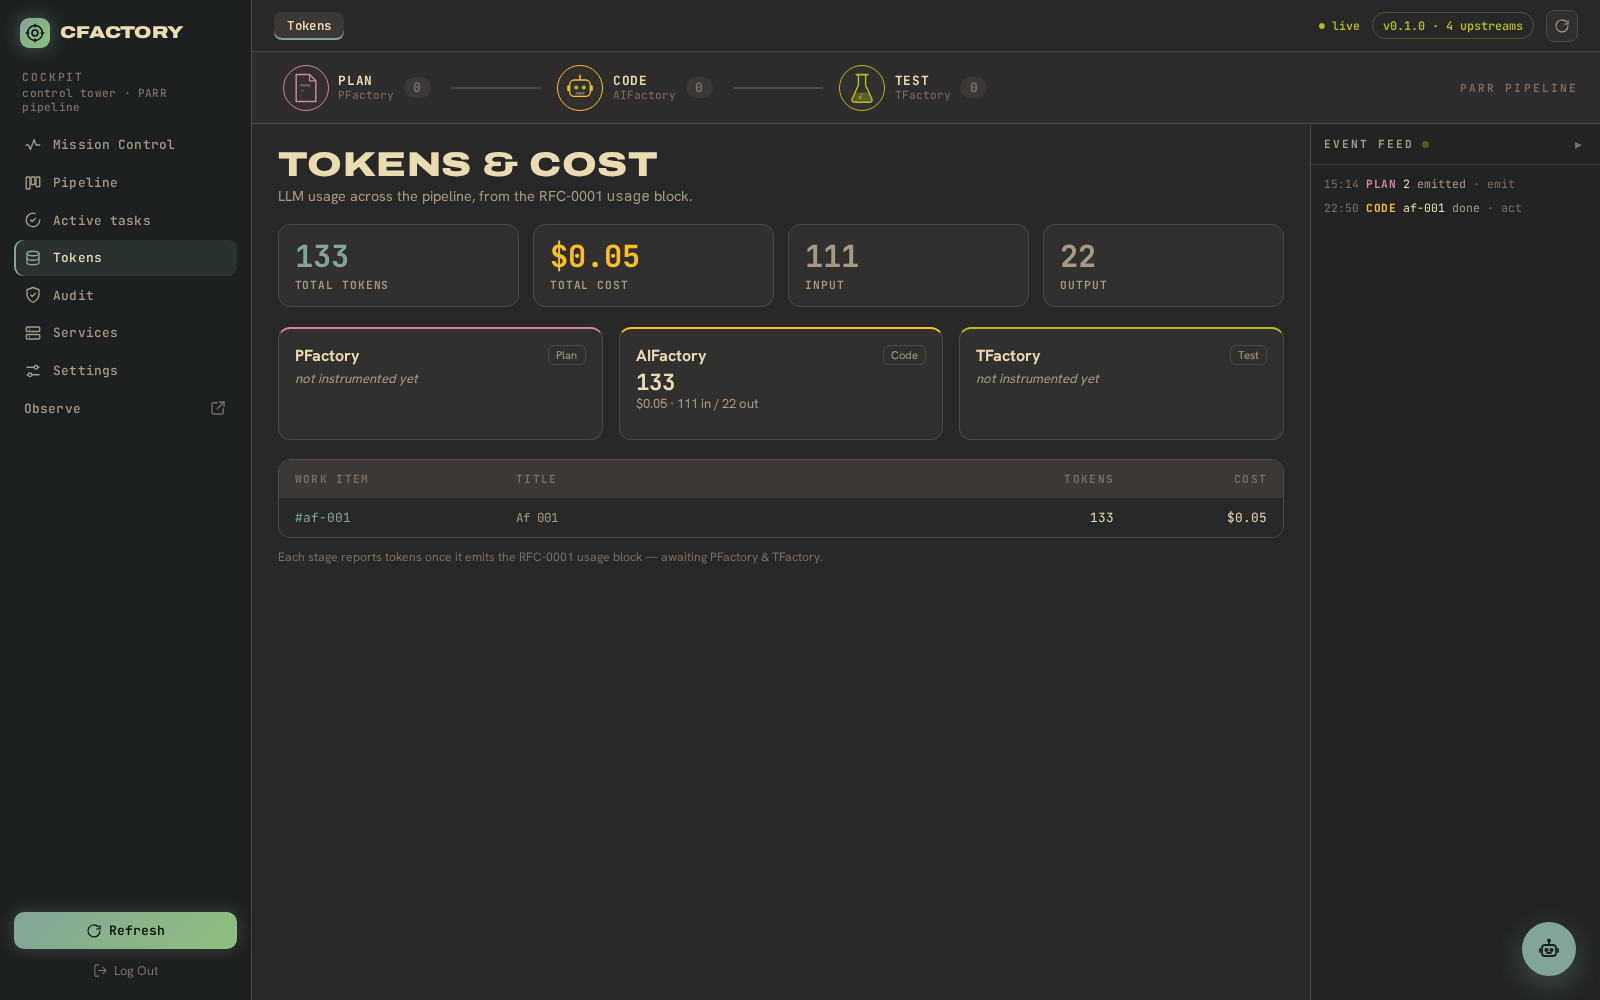
Tokens & cost — real spend across all three stages
Every service attaches the shared RFC-0001 usage block to its completion
events, so the cockpit can total real LLM spend per service and per work item.
Ask “what did this feature cost to plan, build and verify?” and there’s a number,
not a guess.
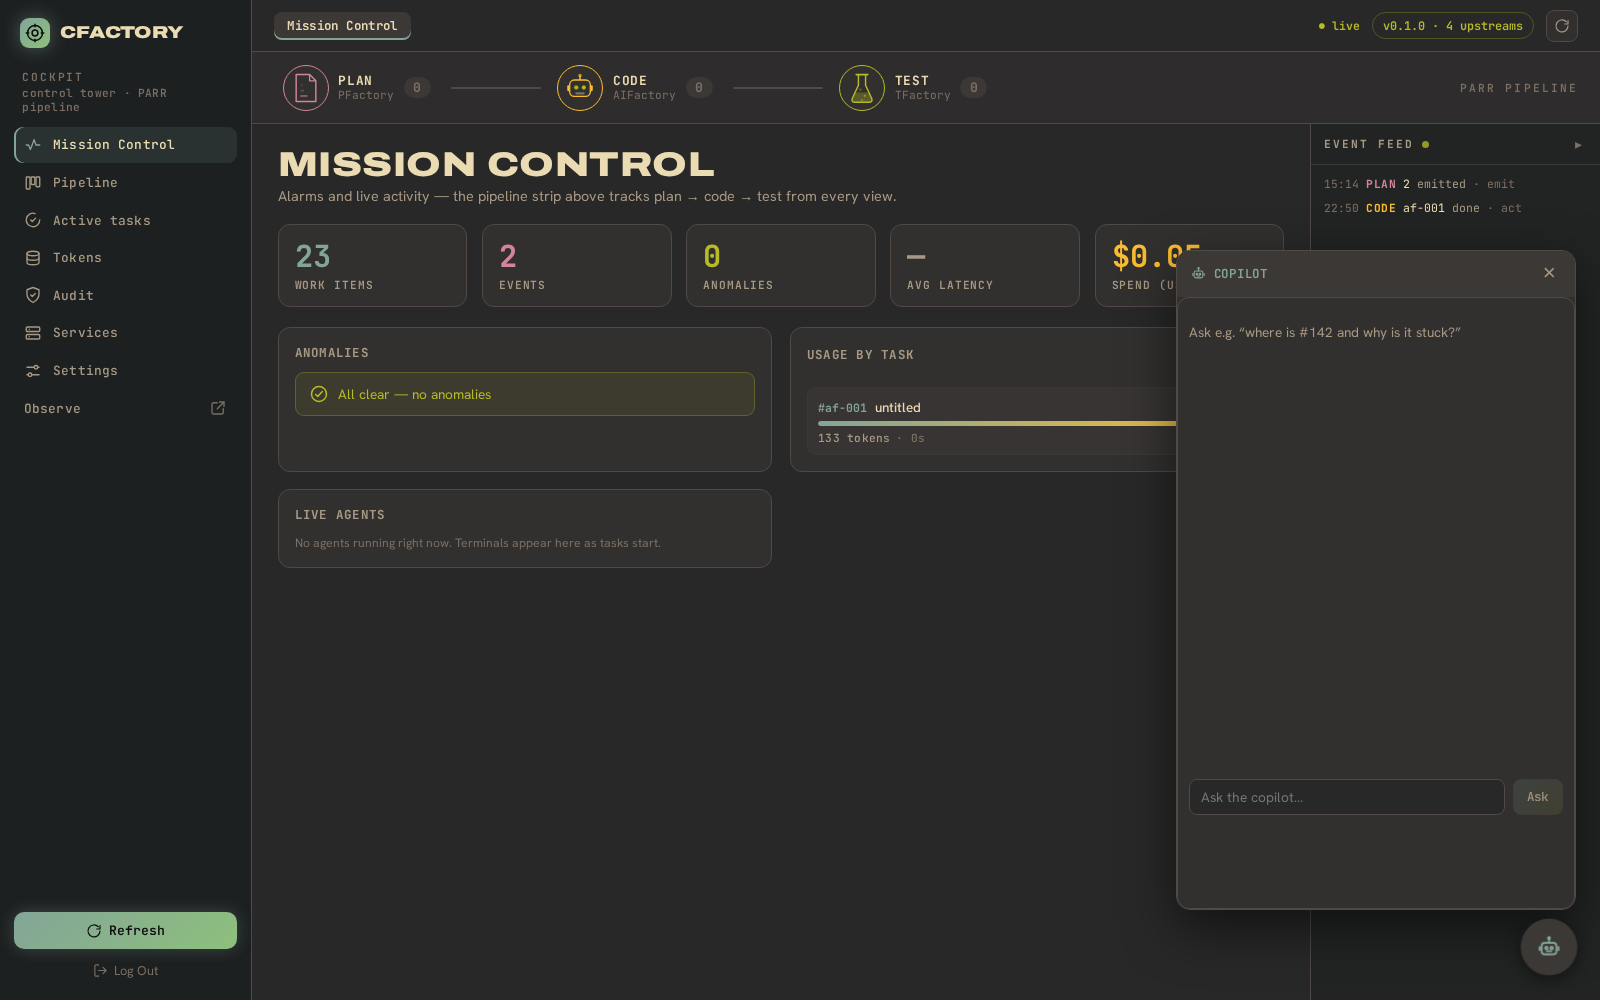
Copilot — insights and an agentic chat
The copilot is an LLM layer whose tools are CFactory’s own functions — query work items, summarise timelines, roll up cost, and surface anomalies as proactive insight cards. Ask it “where is #142 and why is it stuck?” and it answers from the pipeline’s real state. (It now defaults to Claude Opus 4.8.)
Audit — every action, HMAC-chained
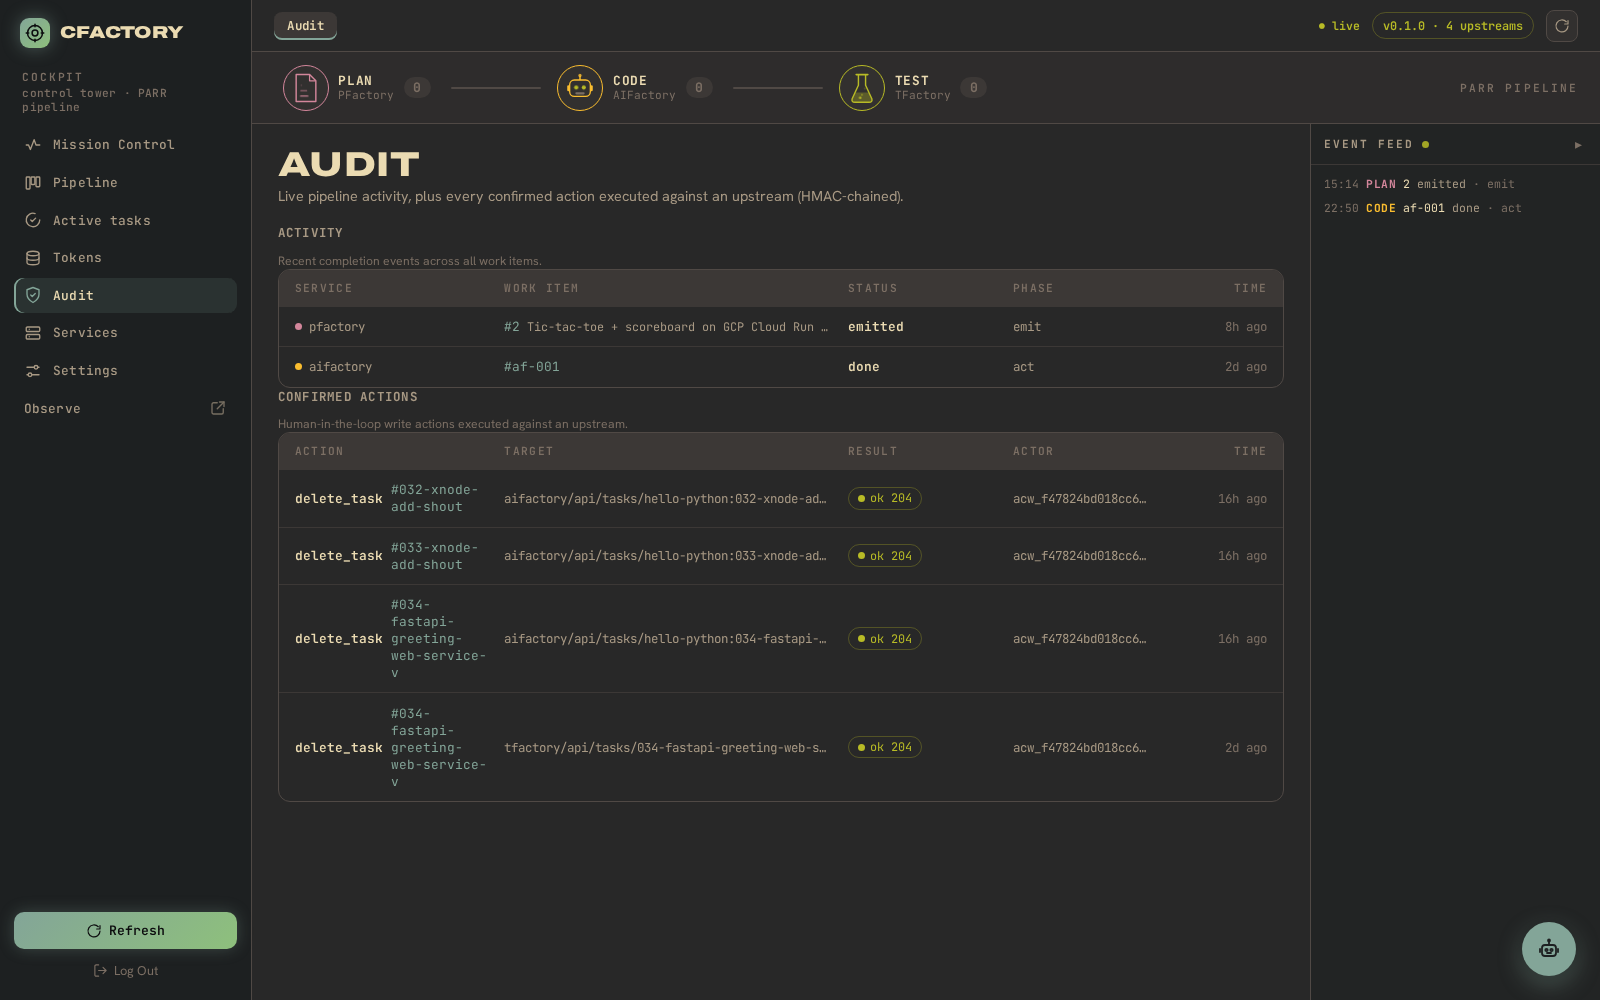
A live activity feed of completion events across all work items, plus a record of every human-in-the-loop write action executed against an upstream. The chain is HMAC-anchored: advise, confirm, and a tamper-evident trail of what was actually done.
Services — health and editable endpoints
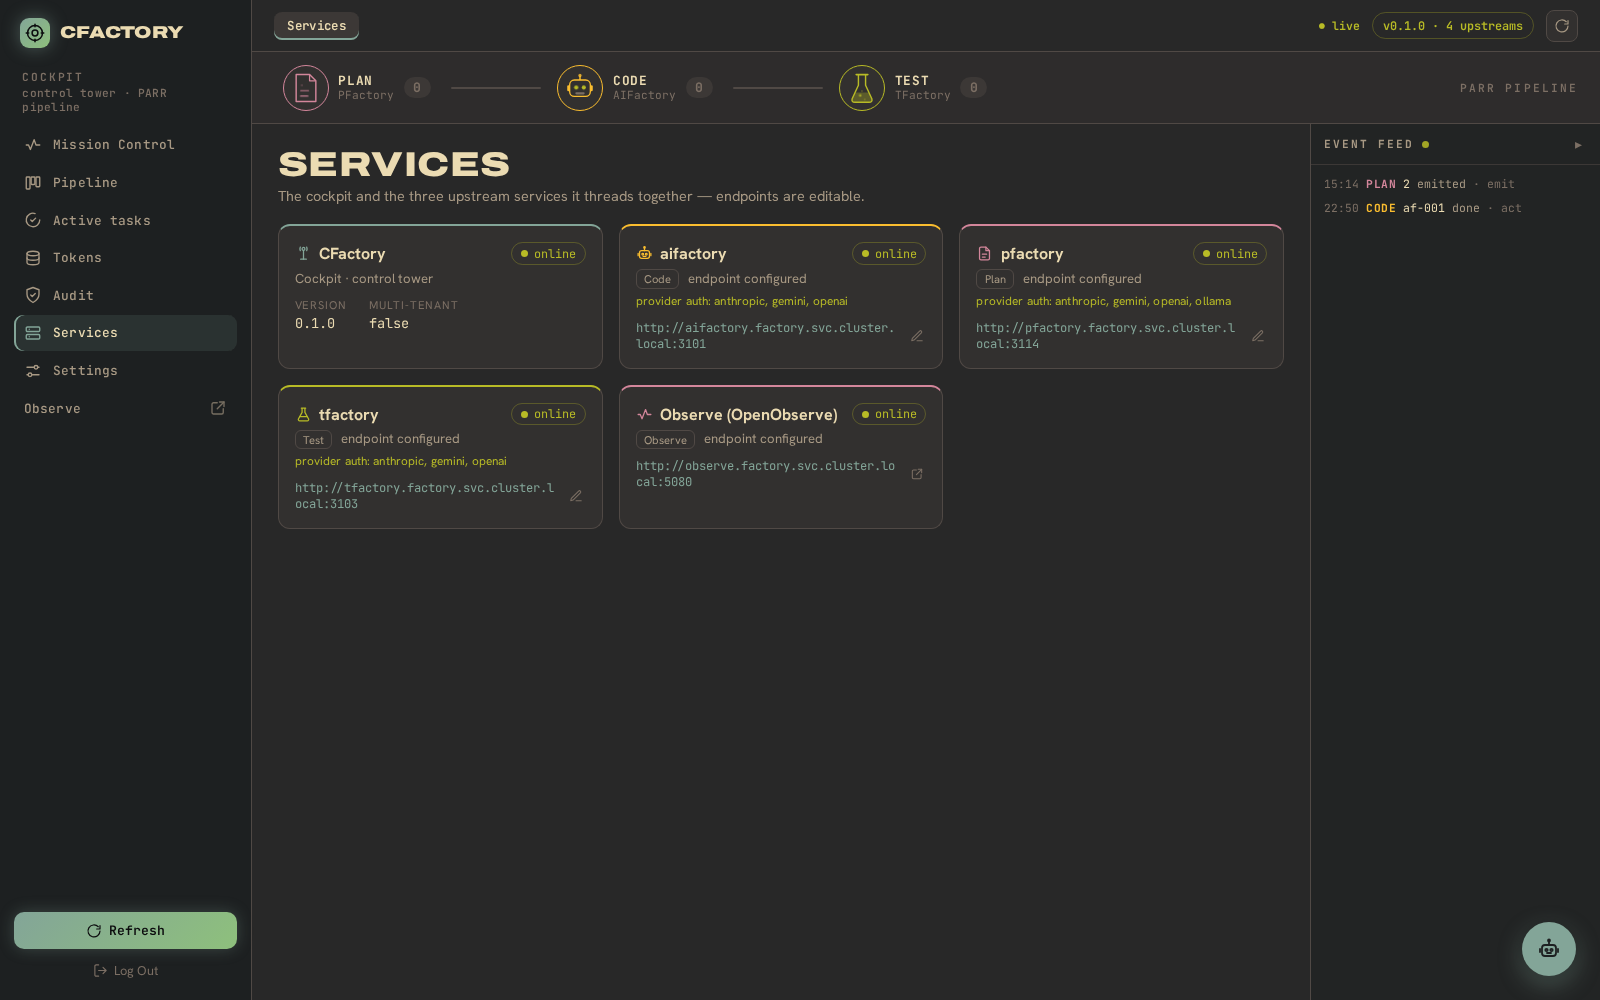
The cockpit and the three upstreams it threads together, each with a health dot and an editable endpoint — point CFactory at a different PFactory, AIFactory or TFactory without a redeploy. As part of this work we also settled the canonical port map (AIFactory 3100/3101, TFactory 3102/3103, PFactory 3104/3105, CFactory 3110/3111).
And the cockpit now ships itself
Behind the UI, the bigger change is operational. CFactory is now containerized
— a backend image and a cockpit image — packaged as a two-pod Helm chart, with
a devenv workflow for local iteration. And the deployment loop is wired: every
push to main builds and pushes both images to GHCR and bumps the tags in the
GitOps repo, so ArgoCD redeploys the cluster on its own.
Why it matters
A board you can only watch tells you that something is happening. A cockpit you can operate — filter the live work, read the audit trail, repoint a service, and ship a change through to the cluster — tells you what is happening and lets you act on it. That’s the difference three days made.
CFactory is built in the open. Follow along on GitHub, or see the architecture and roadmap for where it goes next.