The cockpit shows the graph, the mode, and the logs
Week of 15-21 June: the task-detail view now renders the live execution graph across all three PARR stages, the Tokens page tells metered dollars apart from subscription and local runs, and the concurrency work from RFC-0016 finally has somewhere to be watched. Job-native log streaming is wired through but not yet on by default across the fleet.
This was a week about making the cockpit honest about three things it could only gesture at before: what each task is actually doing, what each run actually costs in the mode it ran, and where the work is happening now that the factory runs many tasks at once. None of it changes how events are ingested. All of it is additive on top of the RFC-0001 event stream the four products already emit.
A note up front, because this site is about what is real rather than what is planned: the cross-fleet rollout of RFC-0017 (the Job-native execution work) is not live everywhere yet. The factory is still running on its safe defaults. The cockpit surfaces are in place and proven against the live cluster; the service-side flips that feed some of them are mid-rollout. Where a panel is ahead of its data, this post says so.
The task graph, across all three stages
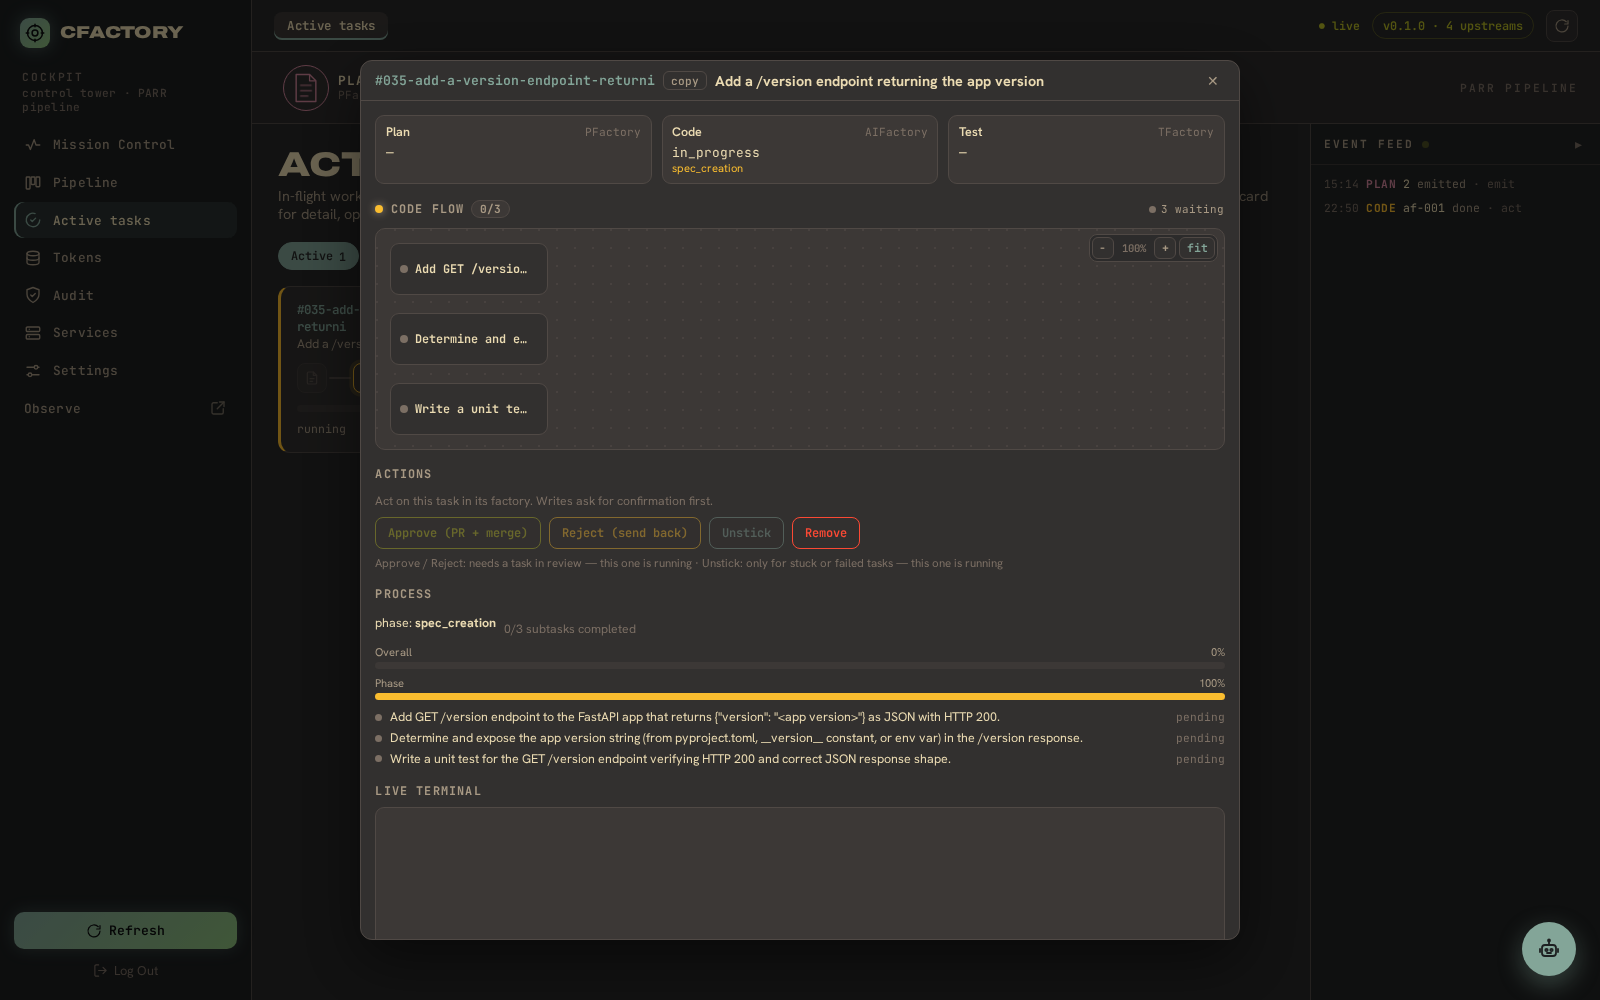
Open any work item and the detail view now draws the live execution graph for the stage that is engaged. It is hand-rolled SVG over HTML node cards – no graph library – using the gruvbox stage palette so plan, code and test are visually distinct. Nodes light up as they run, edges trace the dependencies, and the graph is pannable and zoomable.
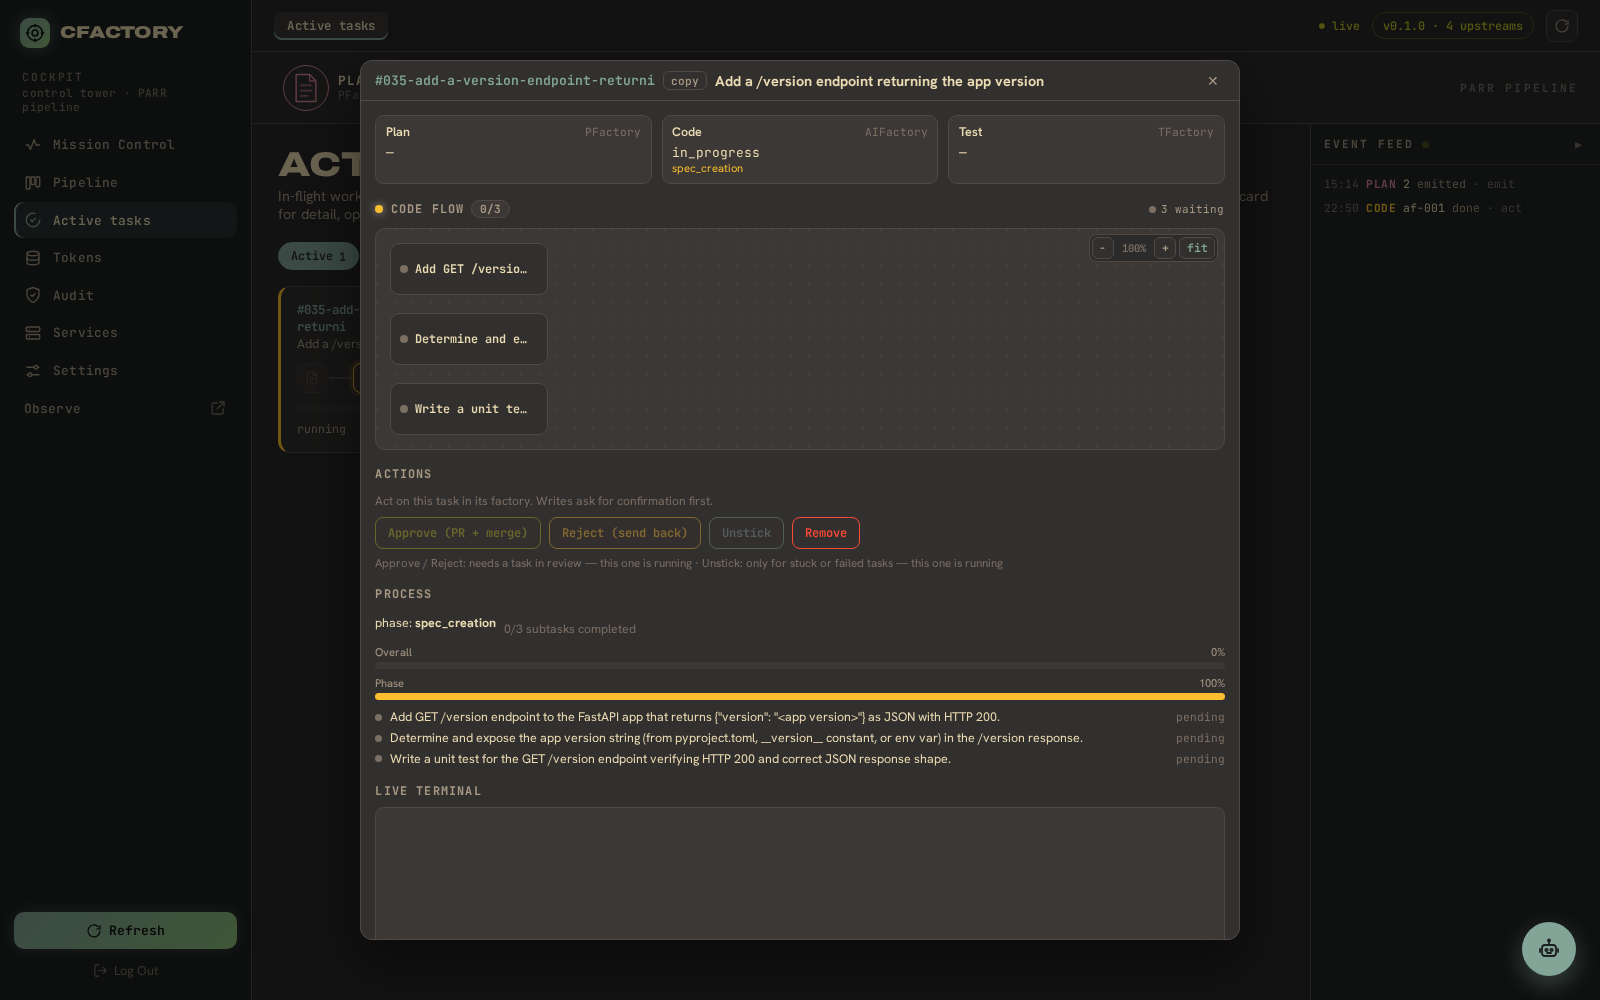
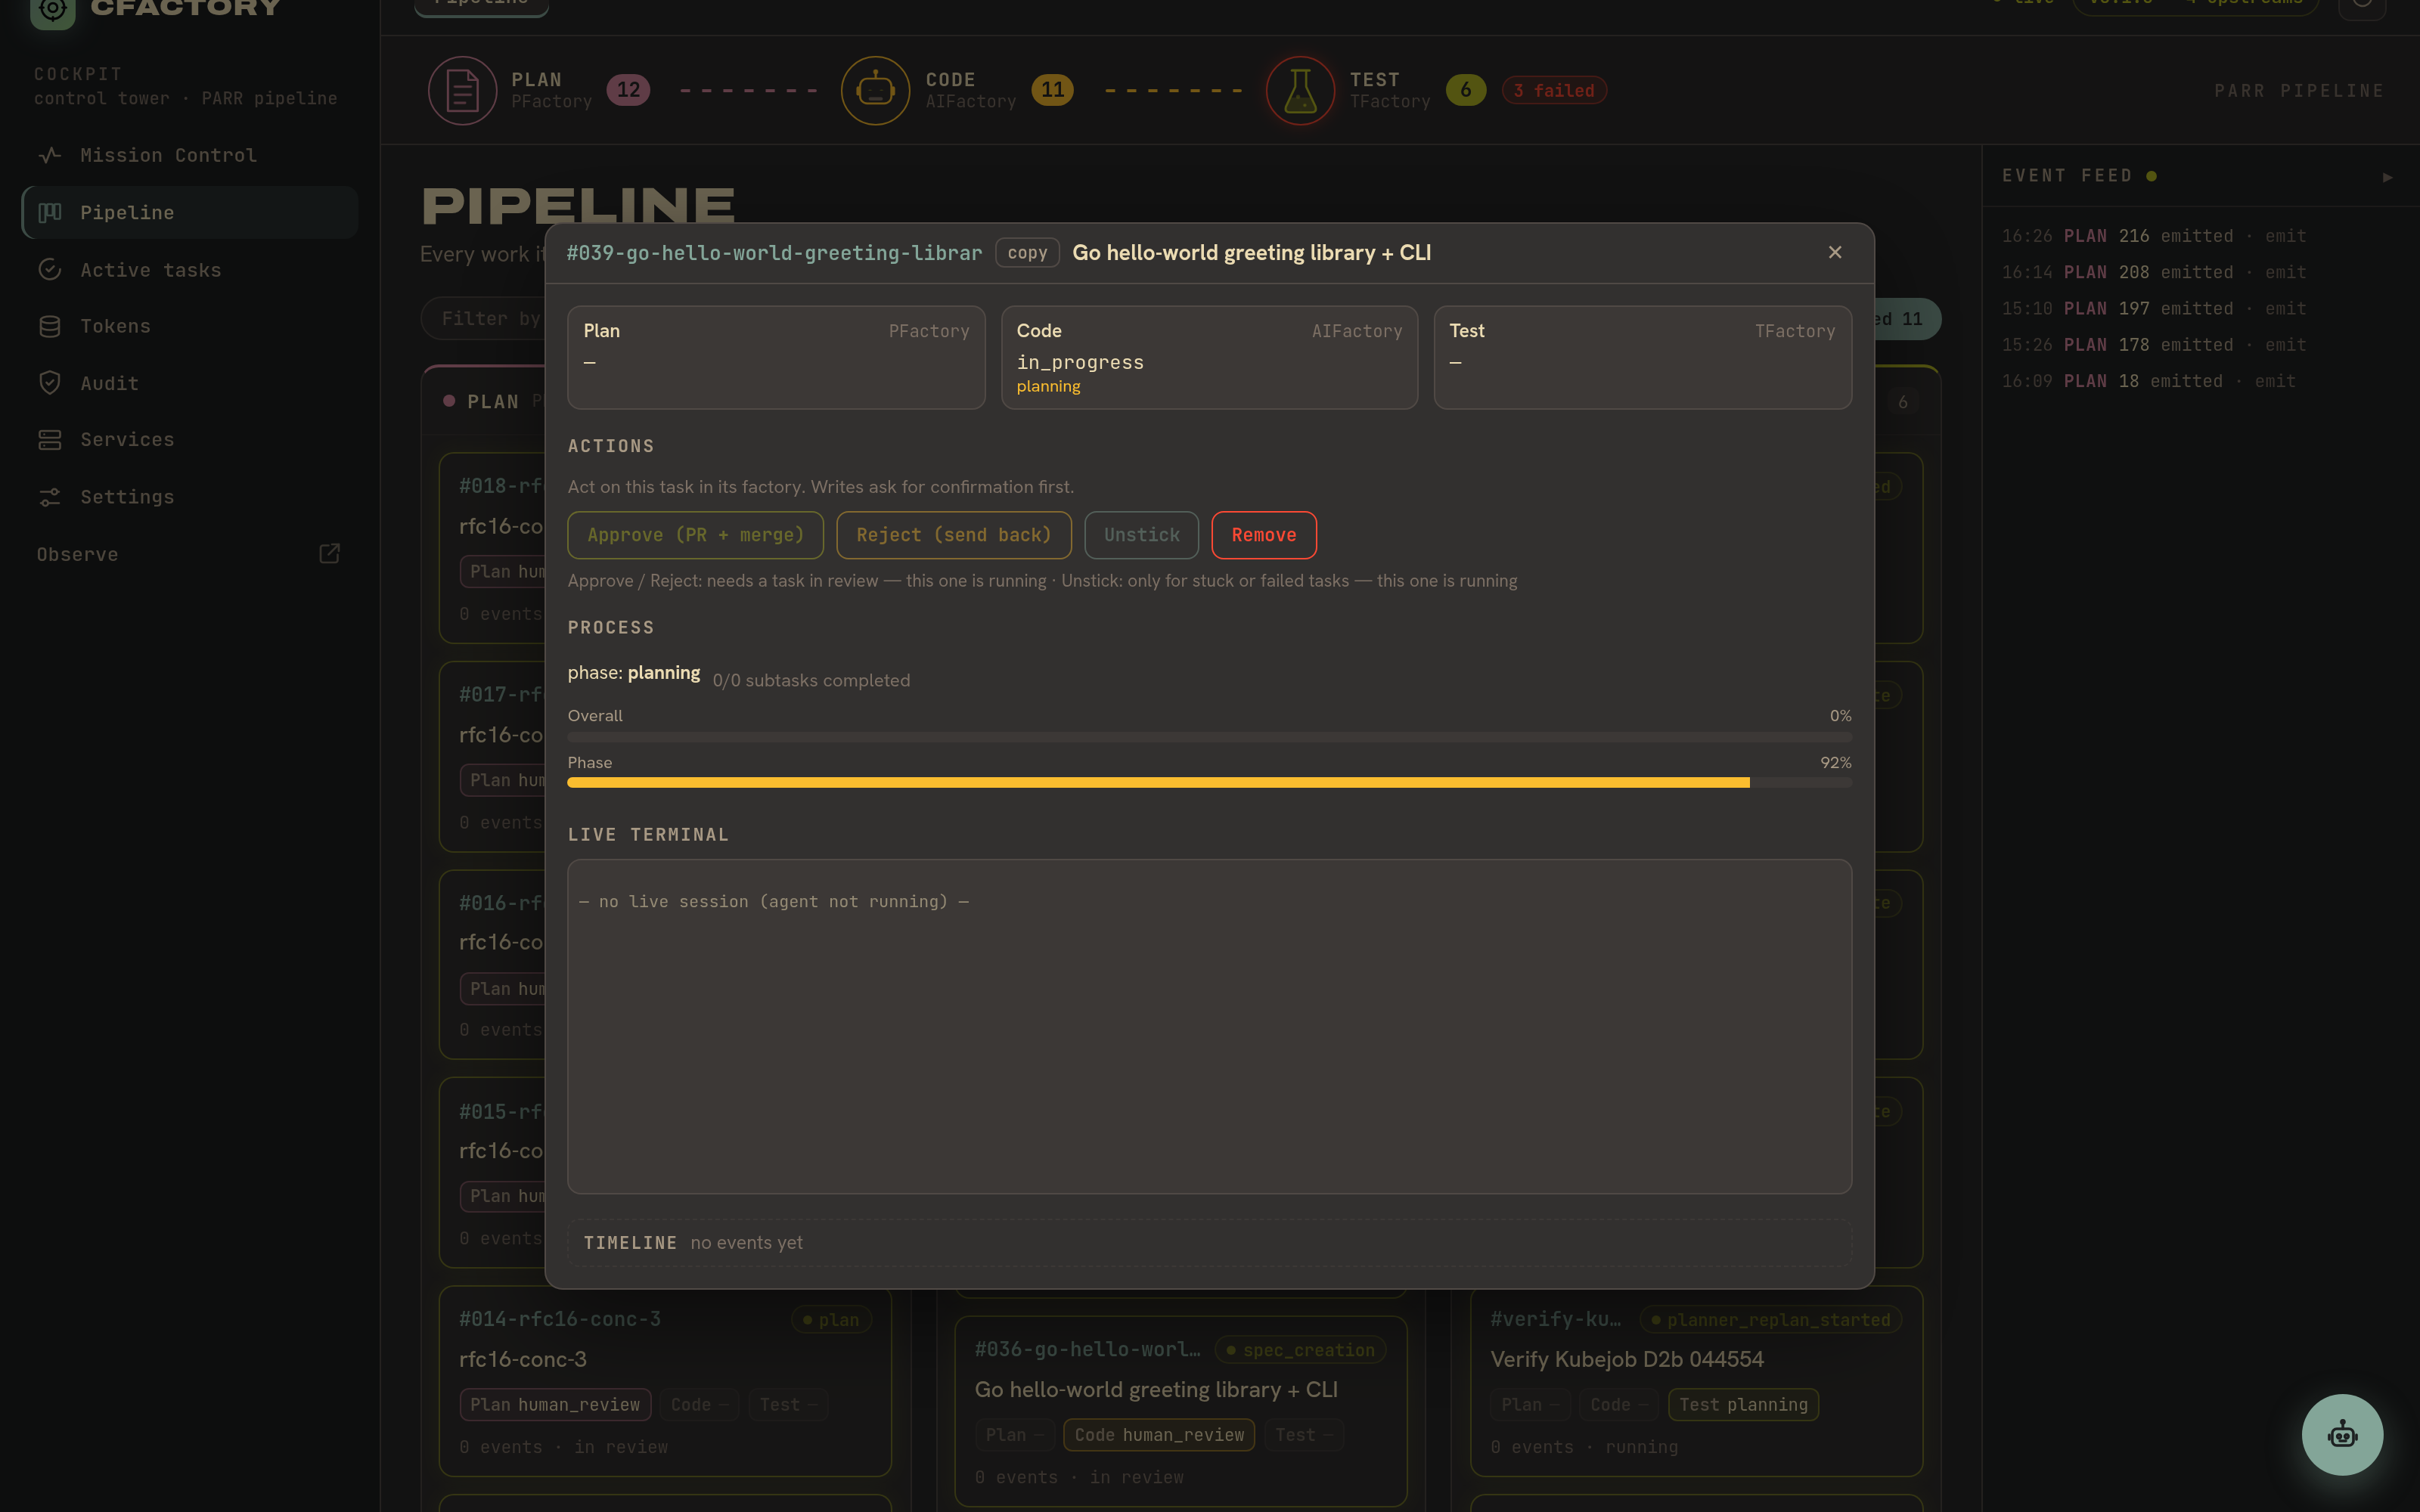
The graph is per-stage but the modal shows all three PARR lanes at the top – Plan (PFactory), Code (AIFactory), Test (TFactory) – with each lane’s status and phase. A plan-only task that never reached verify simply shows nothing in the test lane rather than a misleading empty diagram. The same view carries the in-factory actions (approve and merge, reject and send back, unstick, remove) and a live terminal panel that attaches to the running session when there is one.
Two real examples make the point. A finished LinkLite plan shows its eight acceptance-criteria nodes resolved and feeding a “set up CI/CD” node:
…and a completed Go service shows the code-stage subtask graph driven to 100 percent. The graph is the same component in every case; it just renders whatever the upstream factory reports for the engaged stage.
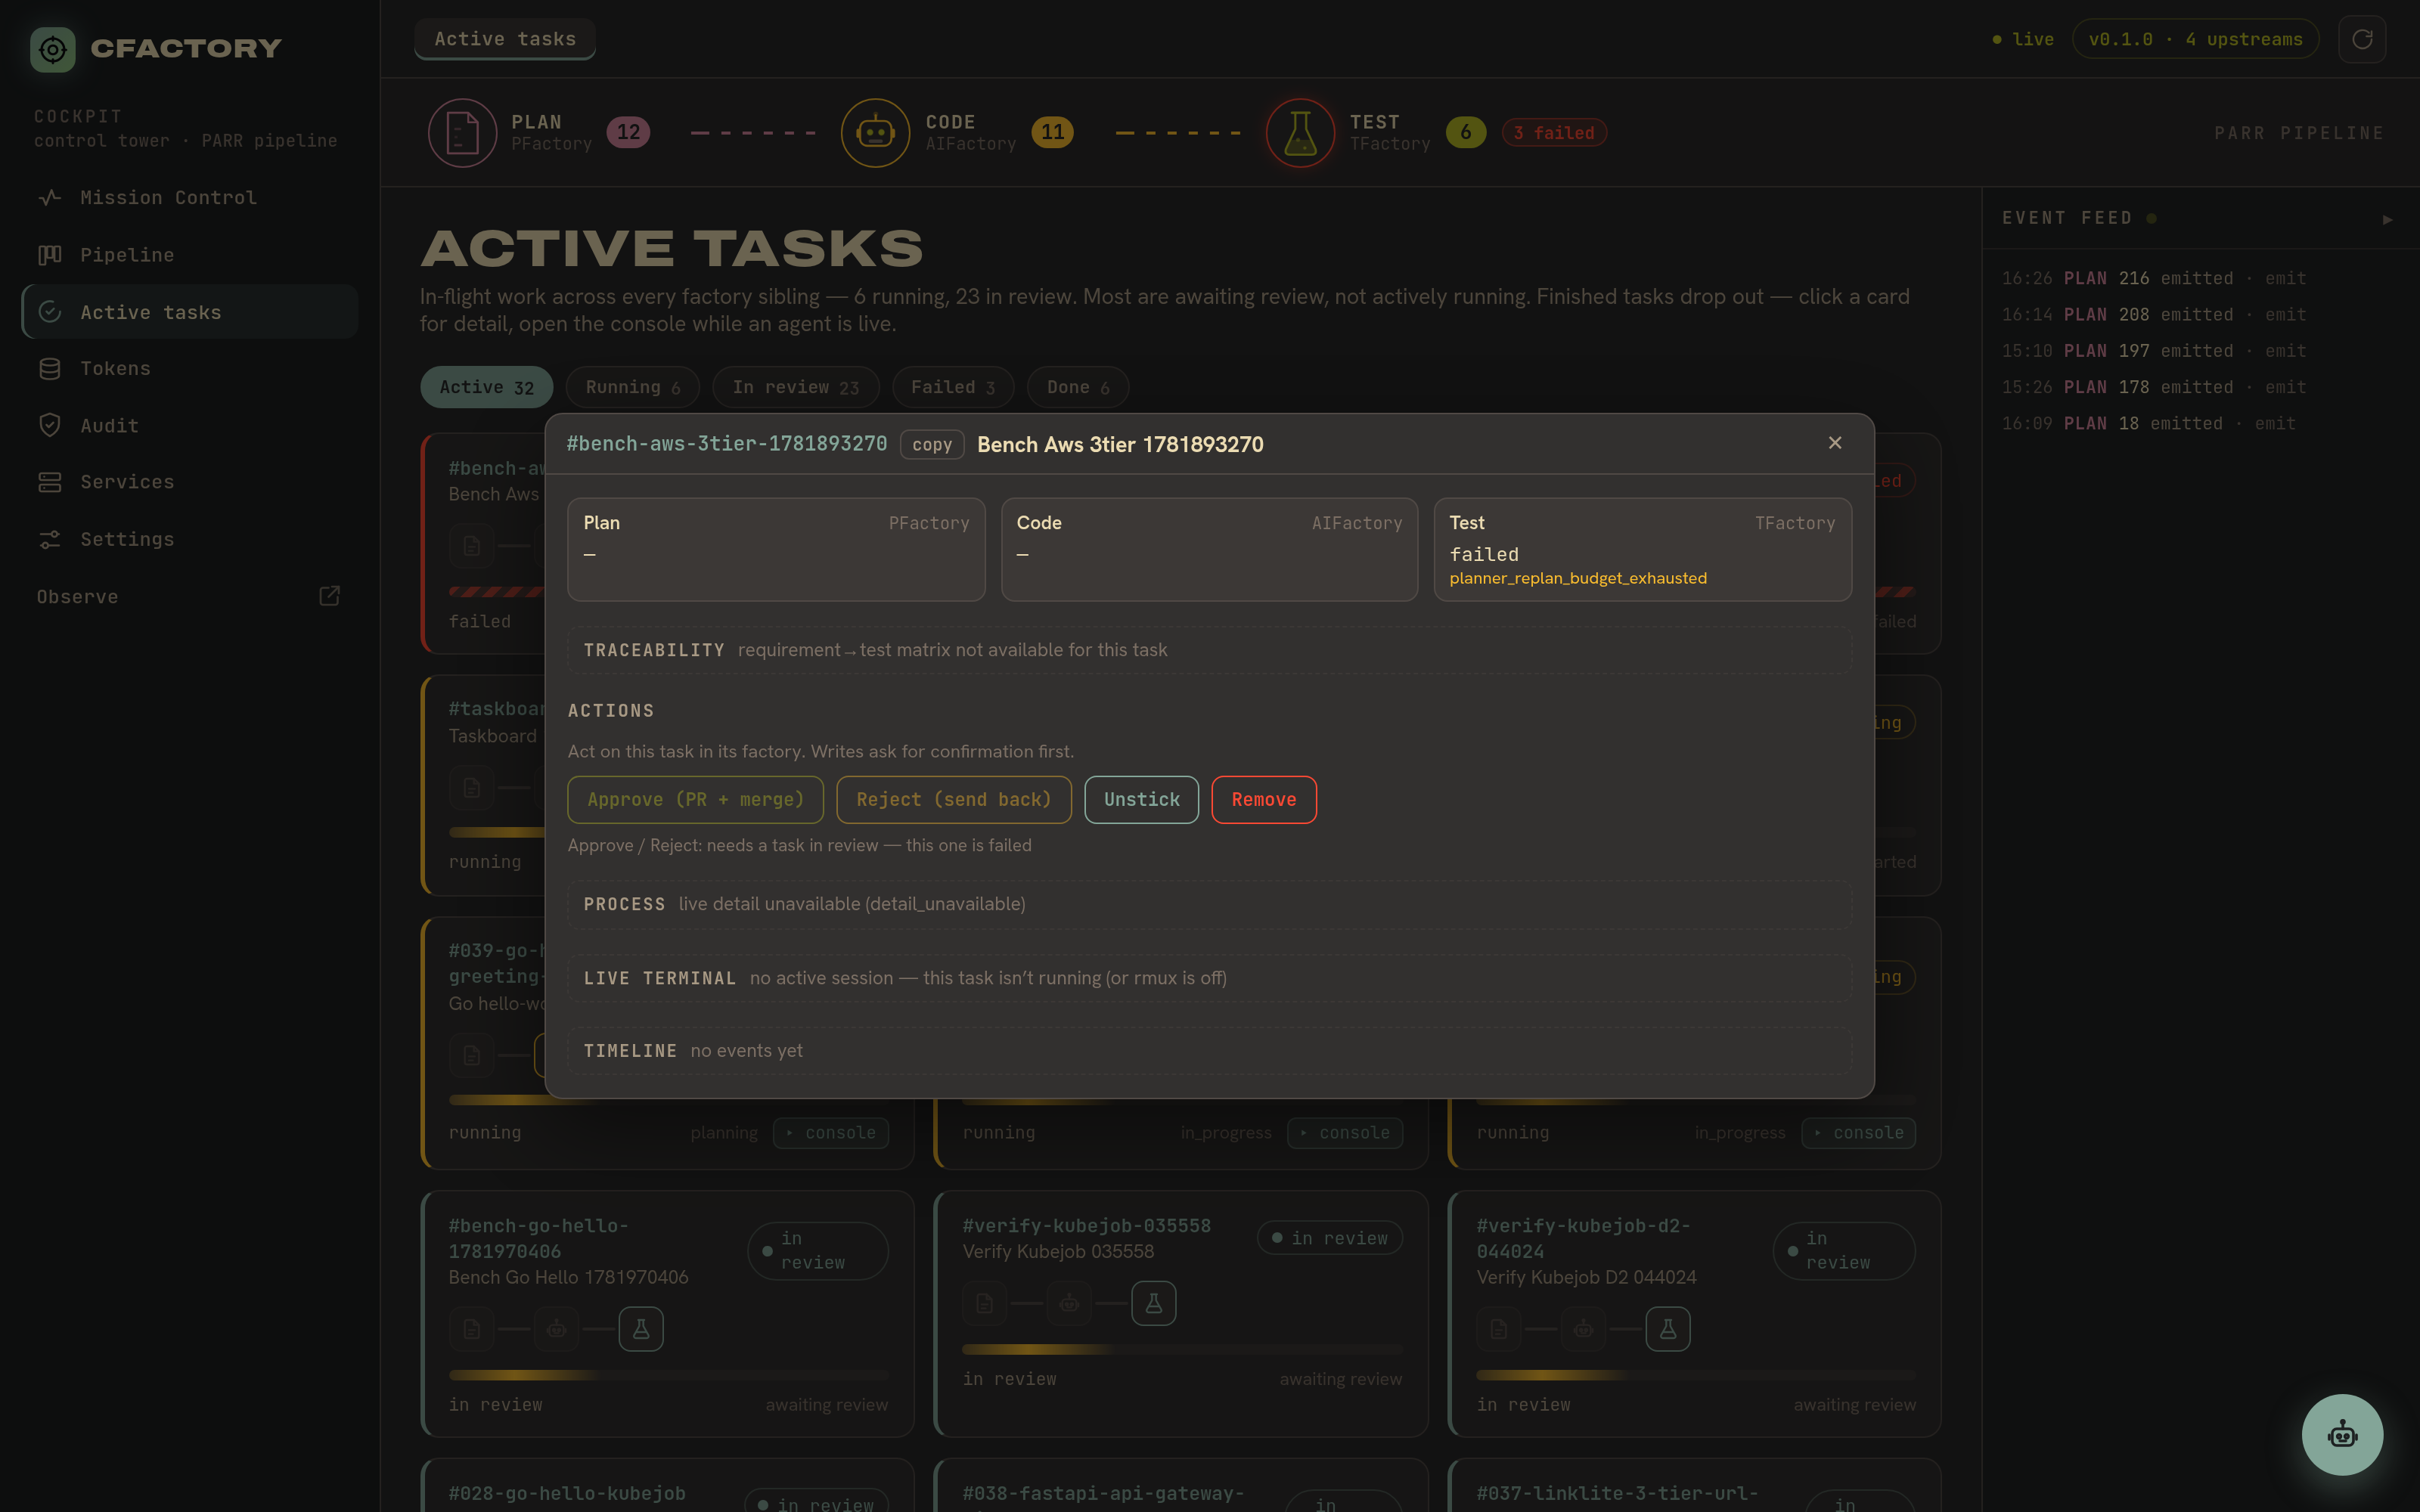
Failures get the same treatment, honestly. When a run fails the cockpit does not hide it. The AWS three-tier benchmark task failed in the test stage, and the detail view says exactly that – stage Failed, the reason carried straight through from the factory, and the unstick and remove controls available to an operator:
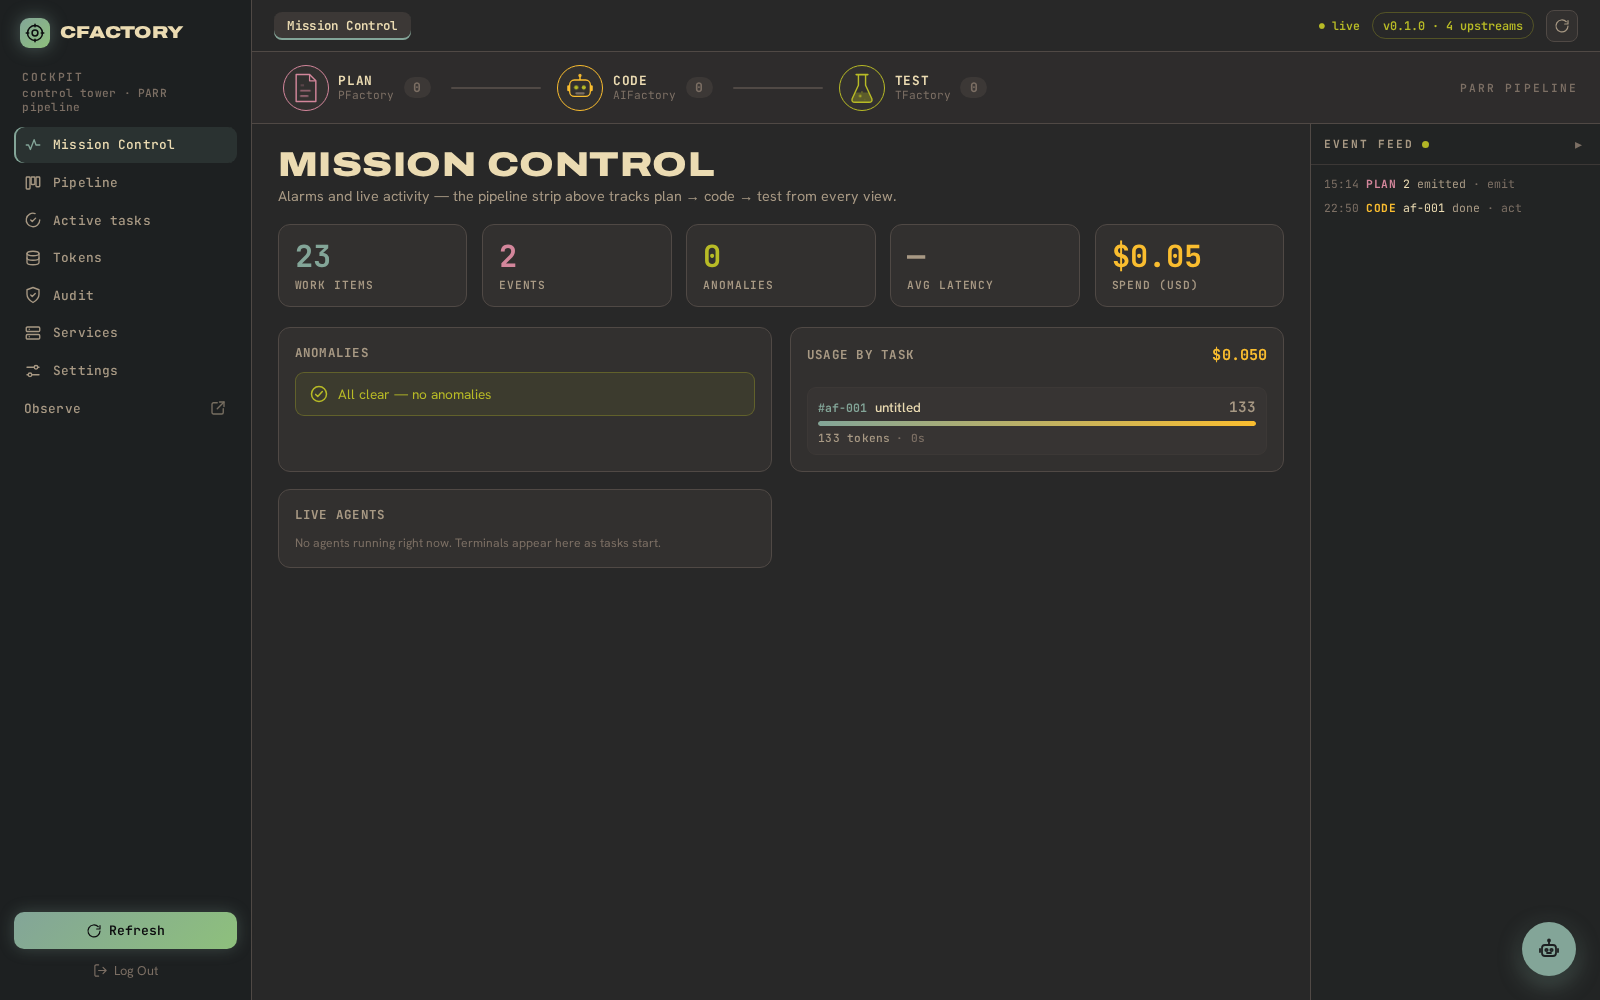
Mission Control rolls those failures up into the anomalies panel at the top of the page, so an operator sees the three failed runs without opening anything:
Billing mode: dollars when metered, tokens and time otherwise
The Tokens and Cost page learned to tell three billing modes apart, because adding up a dollar figure across them is misleading. A metered API run has a real per-token price. A subscription run (a fixed monthly seat) and a local run (your own GPU) do not – their notional dollar cost is zero, so showing “$0.00” as if the work were free is wrong.
So the page now shows dollars only for the metered portion and reports subscription and local work in tokens and wall-clock time instead. Each stage – PFactory, AIFactory, TFactory – gets its own card, and the per-work-item table breaks spend down by task.
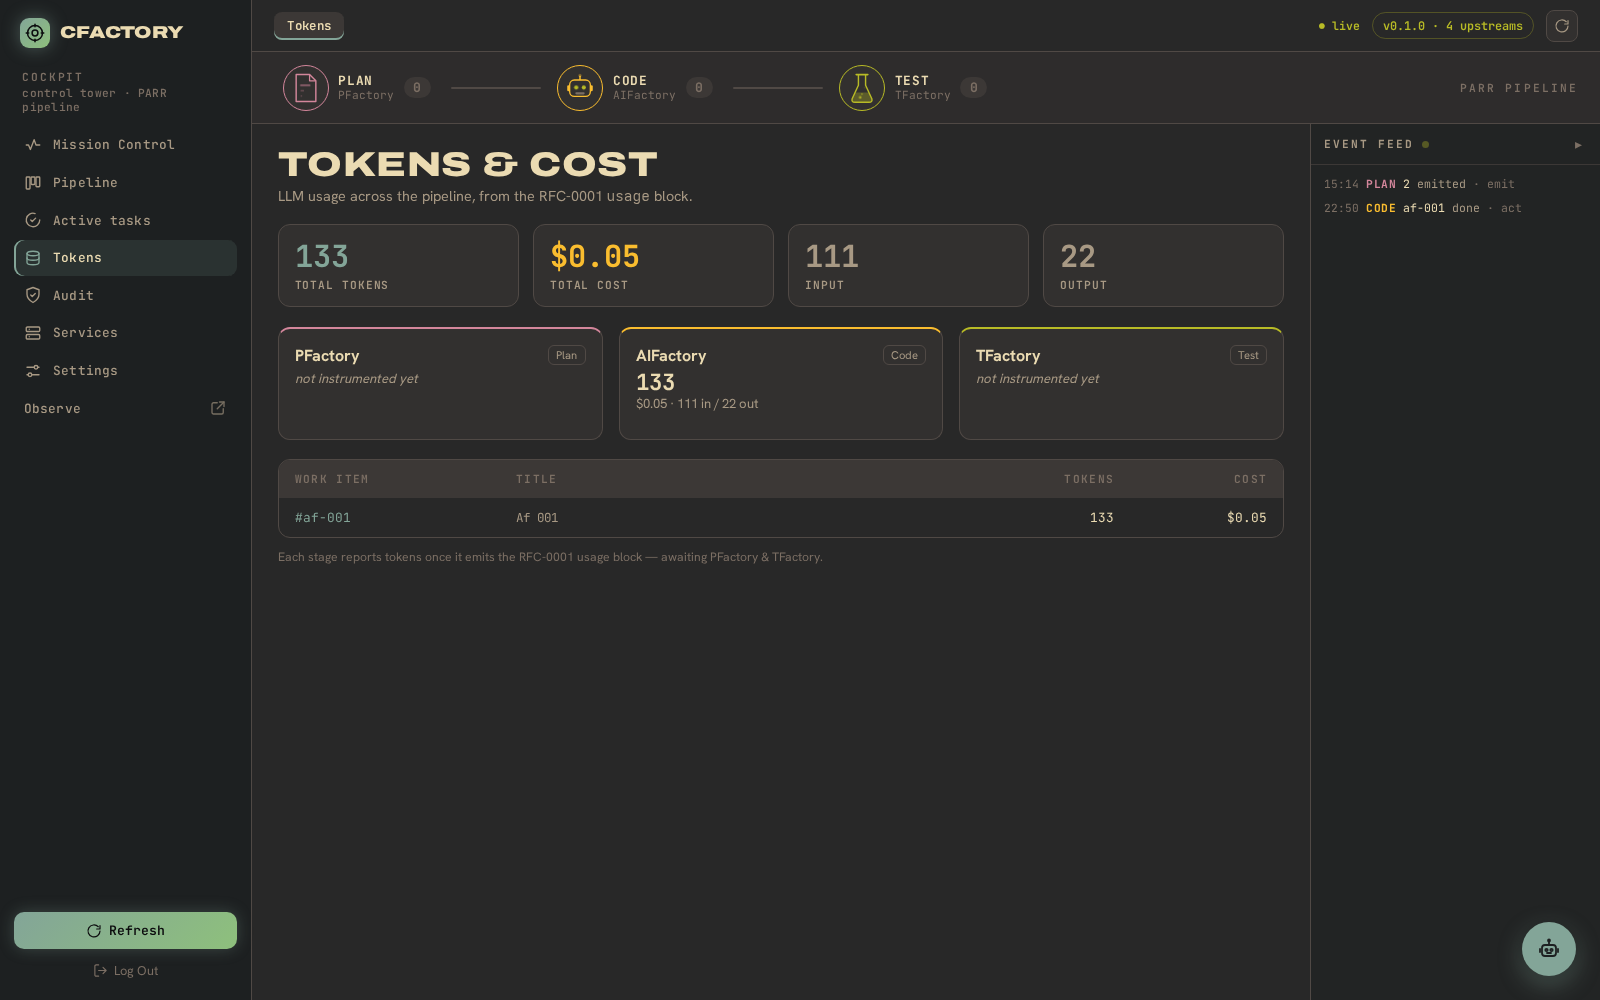
This is one of the places where the surface is ahead of the data. The page is built and correct, but per-worker token observability is still thin: several upstream workers report their usage block late or not at all, so the table reads “no token usage recorded yet” for runs that have not finished an instrumented pass. The wiring is right; the upstream emission is the gap we are still closing.
Somewhere to watch the concurrency
RFC-0016 took the factory from one task at a time to many concurrent tasks behind a stateless control plane, with a Kubernetes Job per task and KEDA scaling the workers. That work needed somewhere to be watched, and the cockpit is it.
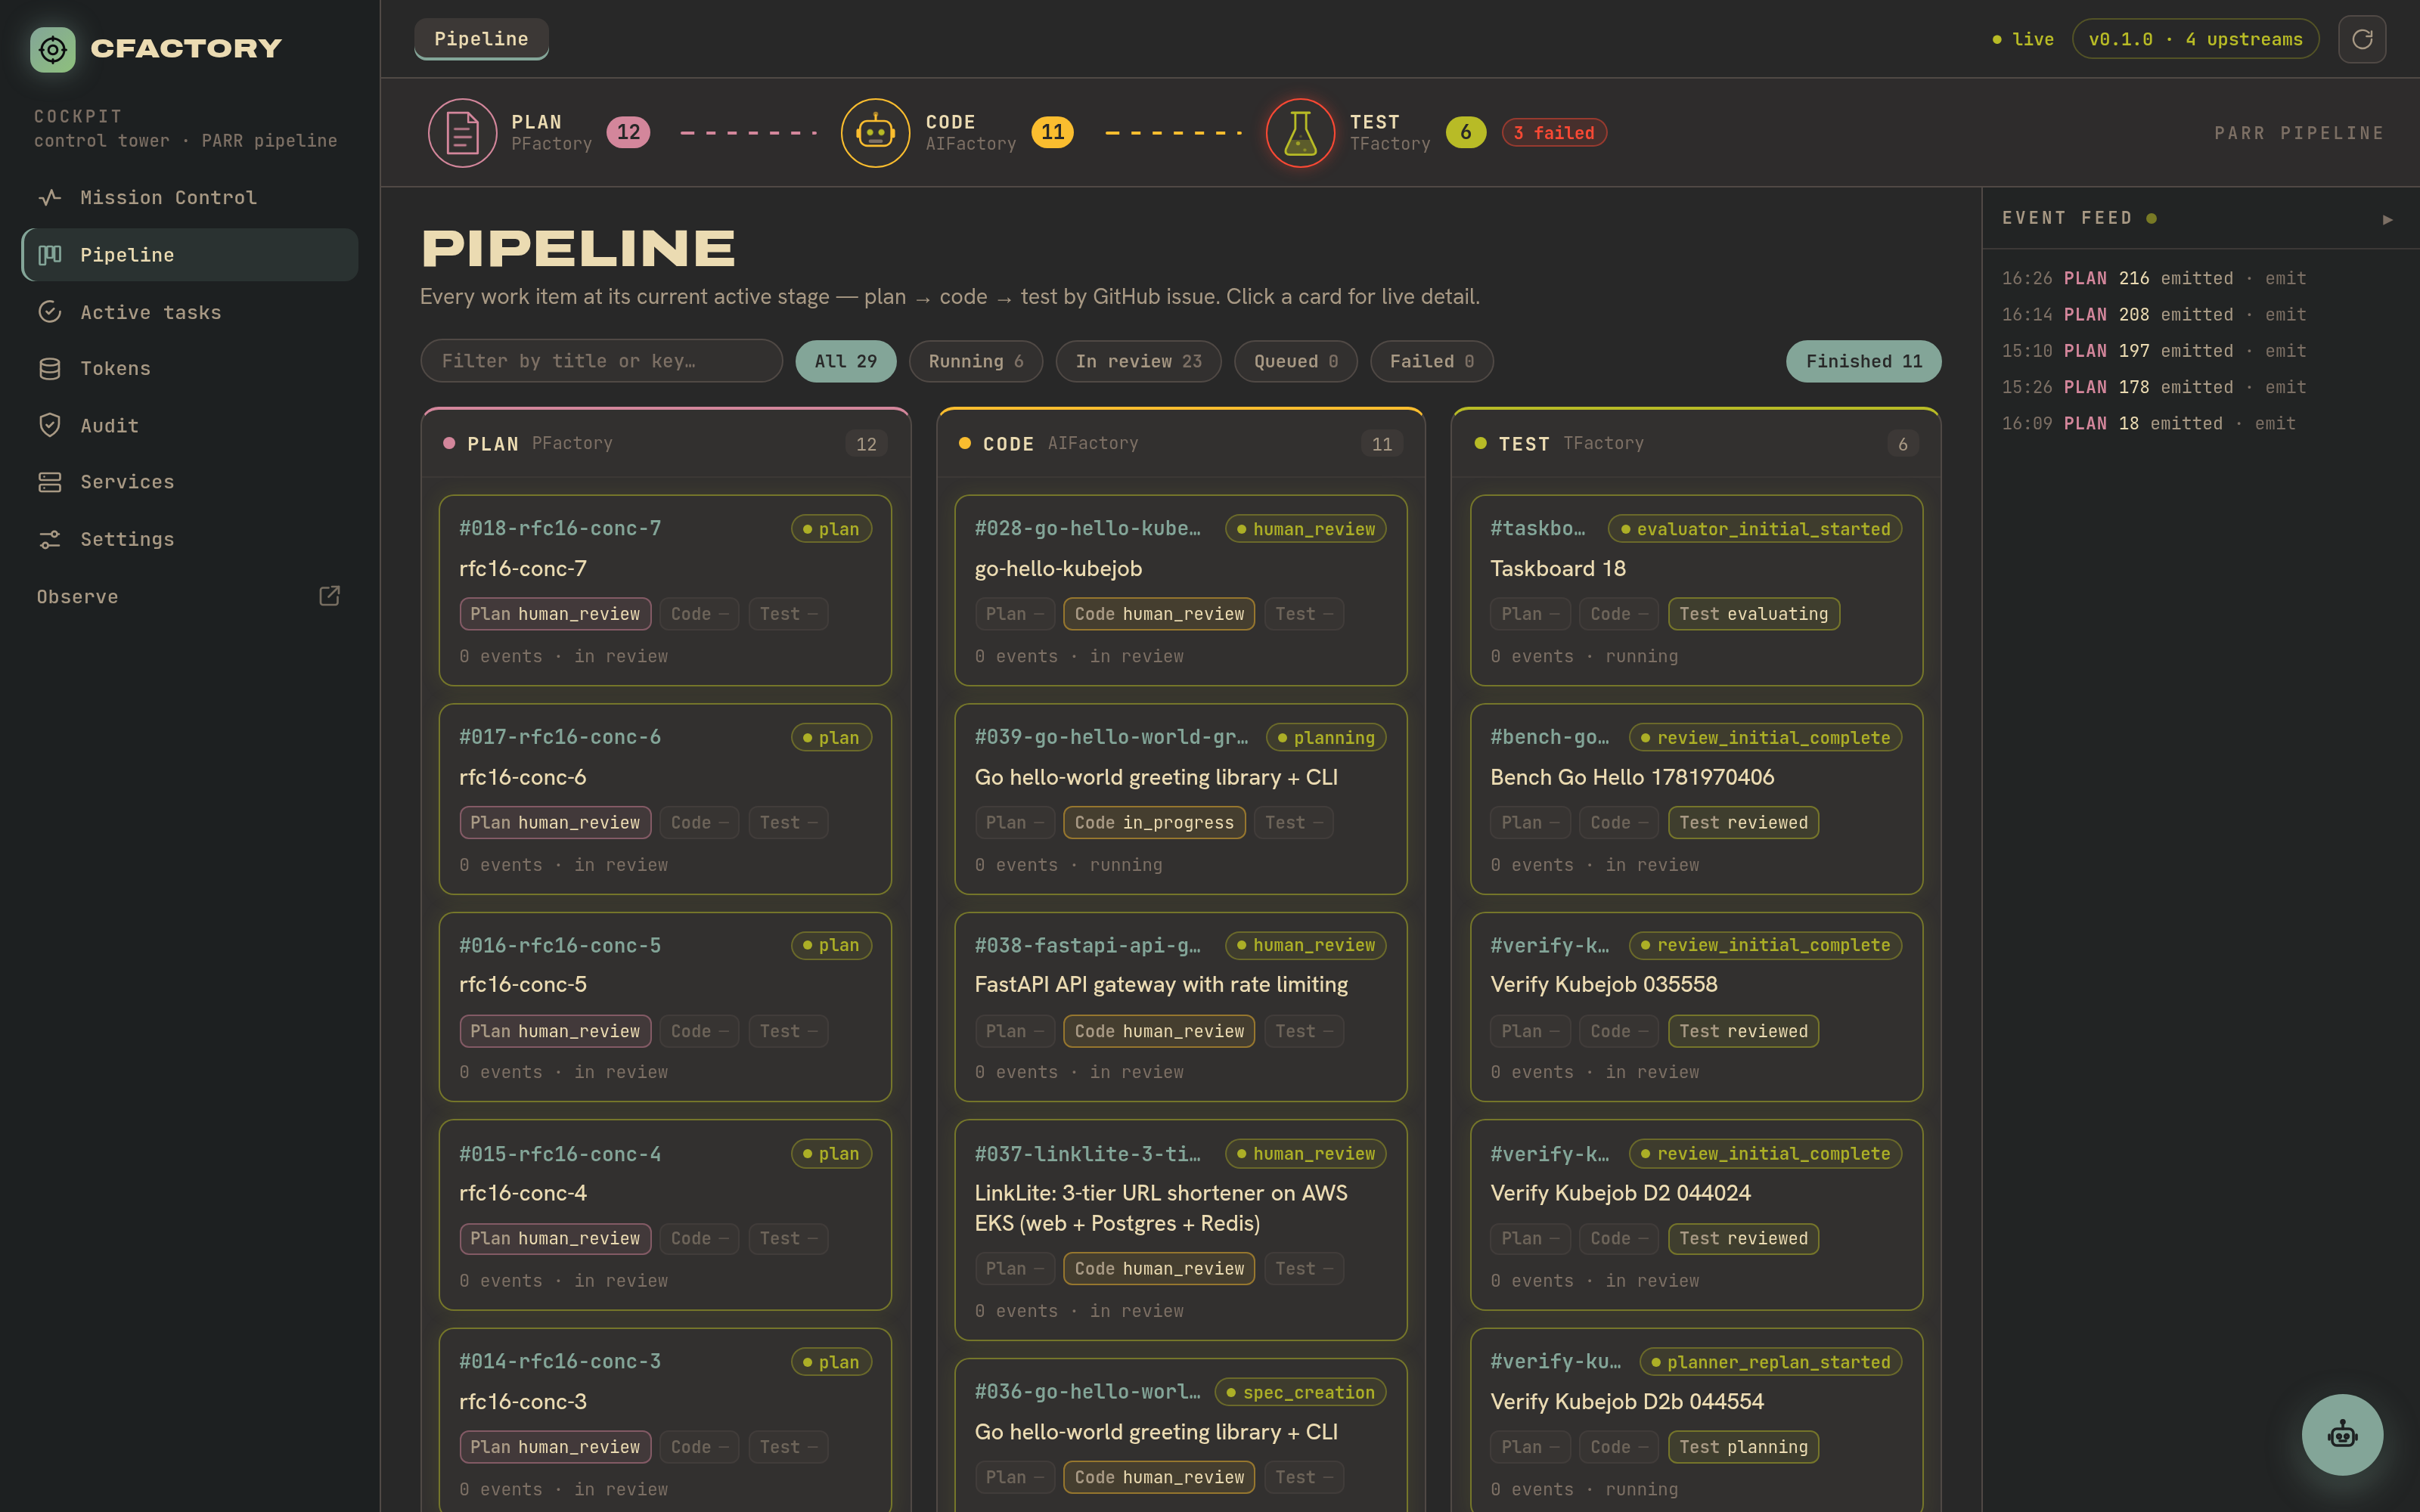
The Active tasks view is the live floor of the factory – every in-flight run, filtered by state, with per-stage progress bars and a live cost stamp where the worker is reporting one. Most work items at any moment are awaiting review rather than actively running, and the view says so plainly rather than implying everything is on fire.
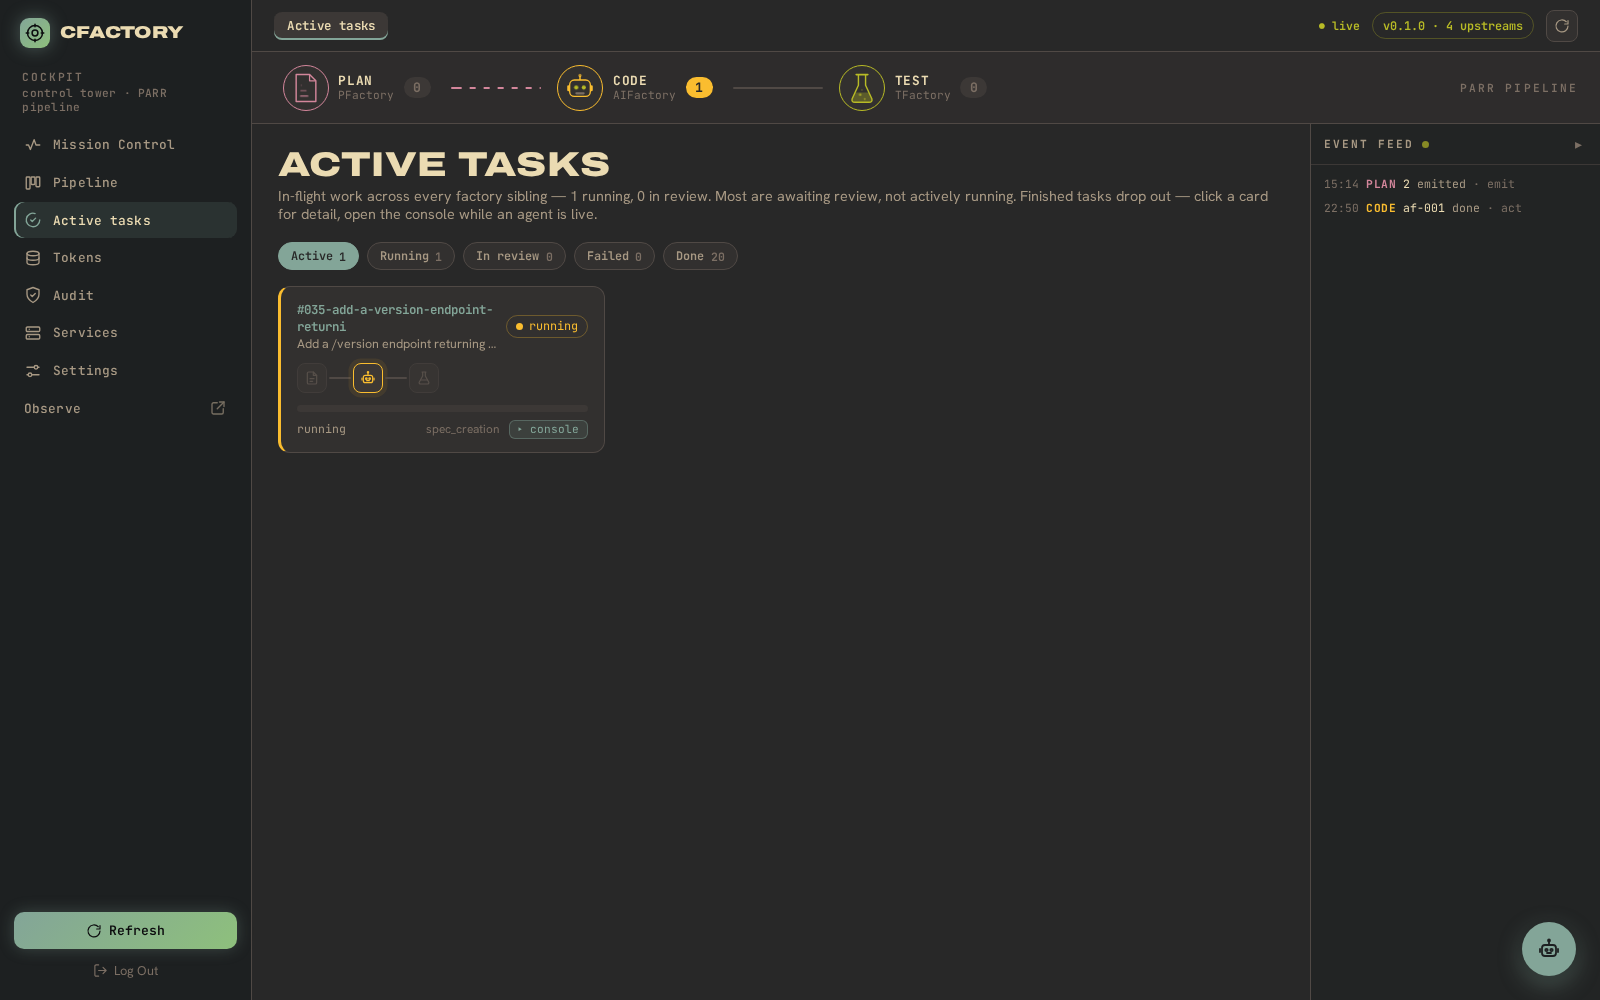
Open one and you get the same detail modal, here on an in-progress task with its test stage still evaluating:
Job-native log streaming: wired, not yet default
The RFC-0017 work to run each task as a first-class Kubernetes Job (rather than inside a long-lived worker) brings its logs with it. The cockpit’s live terminal panel in the task detail is the consumer: when a task runs as a Job, its log stream surfaces there instead of “no active session”. The plumbing landed (the Job-native execution change, #680), and the multi-replica flip is live, but the build and verify default flips were both reverted to safe in-pod defaults pending re-validation – so across the fleet this is still on safe defaults while those are fixed and re-validated. The panel is honest about it: when there is no session it says so.
Everything else is still where you left it
The rest of the cockpit is unchanged and still real: the signed, HMAC-chained audit trail; the Services view with cockpit and upstream health; the Settings view for the copilot provider and editor token; and the floating copilot assistant. The new captioned screenshot gallery walks every view with the same live data behind this post.
As always: additive over the event stream, gated on a real test run before it ships, and honest about the difference between a surface being ready and its data being complete.